The Voltage-Sag Analysis | Run command in the Main Window helps you study the voltage variations at a voltage-sensitive customer's bus (the monitored bus hereafter) caused by short circuits in the vicinity. The program automatically simulates bus faults and intermediate faults in the vicinity of the monitored bus and tabulates the voltage at the monitored bus. Buses are flagged in the report when faults there cause the monitored voltage to drop below the threshold value.
This feature has an automatic stopping criterion that ends the simulations when the monitored voltage is above the threshold for all the faults at a certain distance away. You must select the monitored bus before running this command.
The output of this command is a CSV-formatted file that can be opened with any spreadsheet program.
TO PERFORM A VOLTAGE SAG ANALYSIS:
1. Right mouse click on the monitored bus to select it.
The selected bus will turn red.
2. Select the Faults | Voltage Sag Analysis | Run command.
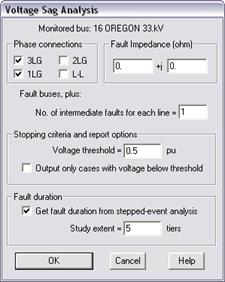
A dialog box will appear asking you for voltage sag analysis parameters.

Note: This command will be dimmed and cannot be selected if no monitored bus was selected on the one-line diagram.
2. Enter voltage sag analysis parameters.
Mark one or more phase connections: 3LG, 2LG, 1LG or L-L for 3-phase, 2-line-to-ground, single-line-to-ground and line-to-line faults.
Enter fault impedance in ohm.
Enter the number of intermediate fault to be simulated on each transmission line (in addition to bus faults). ‘1’ means a single intermediate fault at 50% will be simulated for each line. ‘2’ means two intermediate faults at 33.3% and 66.7%, and so on.
Note: No intermediate faults are simulated on lines with very small impedance.
Enter voltage threshold in per unit. The program will flag faults that cause one or more phase voltages at the monitored bus to go below this threshold value. The voltage threshold also serves as a stopping criterion. The program begins by faulting the monitored bus, and then it will fault all the buses and lines that are one bus away from the monitored bus, and then two buses away, and so on. We refer to these fault buses as tier-1 buses, tier-2 buses, etc. The program will continue simulating faults until it finishes faulting buses at a certain number of tiers away and found that the voltage magnitude at the monitor bus stays above the voltage threshold when faults are applied to all the buses within that tier.
Click on check box “Output only cases with voltage below threshold” to include in the output only cases in which the voltage magnitude at the monitored bus is below the voltage threshold.
Click on check box “Get fault duration from stepped-event analysis” to compute the duration between the on-set of the fault and the time of the last event.
Enter the stepped-events’ study extent in number of tiers from the faulted bus. The program will simulate only the operations of protective devices that are within this area during the stepped-event simulation.
3. Press OK to start the analysis.
A Save File dialog box will appear asking you for file name.
Use the controls in the standard file dialog box to specify the name of the output file, which must be a CSV-formatted file.
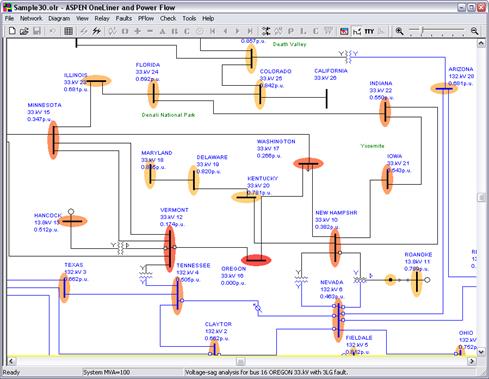
When the analysis is complete, OneLiner will display the voltage-sag results on the one-line diagram. Specifically, the monitored-bus voltage in per unit will be shown below each of the faulted bus name. The program will also paint a colored halo around each faulted bus to help you visualize its effect on the monitored bus. The more severe the voltage sag at the monitored bus caused by a fault, the darker halo will be painted around the faulted bus.
In the sample one-line display below, the bus Oregon 33kV is the monitored bus. The caption at the bottom of the window tells you that this display is for 3-phase faults.

4. View contents of output file.
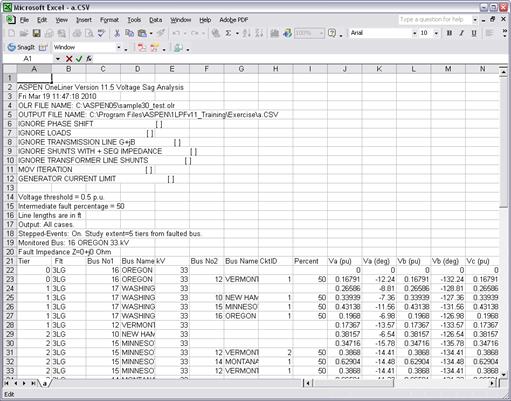
The program will ask you if you wish to view the output file. If you answer ‘yes’, you will see a spreadsheet that looks like this.

The voltage-sag report fields are:
Tier: 0 if the monitored bus is being faulted. 1 if the faulted bus is one tier from the monitored bus. 2 if the faulted bus is two buses away, and so on. .
Flt.: Fault connection: 3LG, 2LG, 1LG, and L-L for 3-phase, 2-line-to-ground, single-line-to-ground, and line-to-line fault, respectively. The fault is a bus fault if the ‘Percent’ field is blank. Otherwise it is an intermediate fault.
Bus No.1, Bus Name, kV: Identifier of Bus1. This is the faulted bus for bus faults. For intermediate faults, this is the line terminal that is considered zero percent.
Bus No.2, Bus Name: Identifier of the end bus (Bus2) for intermediate faults.
CktID: Circuit ID of the line between Bus1 and Bus2.
PERCENT: Location of the intermediate fault, with Bus1 being 0% and Bus2 100%.
Va(pu), Va(deg): Phase-‘a’ voltage at the monitored bus.
Vb(pu), Vb(deg): Phase-‘b’ voltage at the monitored bus.
Vc(pu), Vc(deg): Phase-‘c’ voltage at the monitored bus.
<Threshold: ‘YES’ if the magnitude of one or more of the phase voltages at the monitored bus is below the threshold value.
R (pu),X(pu) Resistance and reactance of the line in per-unit. These columns are blank for bus faults. These values can be used to estimate the line length when the ‘Length’ parameter is not available.
Length Length of the line in a common unit of length (see report header). This column is blank for bus faults.
V1(pu), V1(deg): Positive-sequence voltage at the monitored bus.
V2(pu), V2(deg): Negative-sequence voltage at the monitored bus.
V0(pu), V0(deg): Negative-sequence voltage at the monitored bus.
The following columns in the report will appear only if you selected the option to get fault duration from stepped-event analysis:
Events: Total number of events.
Clearing (s): Time lapse between the on-set of the fault and the time stamp of the last event.
Final Amps: The fault current at the faulted bus at the last event.
Note: A clearing time of 9999 means no protective device operated. A finite clearing time together with a nonzero final fault current means the fault was not cleared. A value of 0 for the ‘Final Amps’ together with 2 or more Events indicate that the fault was cleared by protective devices. Only in this case should the ‘Clearing (s)’ be interpreted as the total fault duration.
Main Window
FAULTS MENU