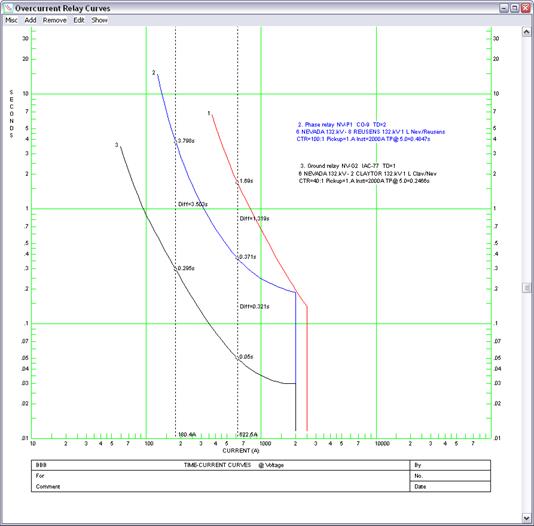
The Add | Time Difference Sliders command in the OC Curves Window lets you add two “sliders” to the plot. Each slider is a vertical line that you can move horizontally with the mouse. When the slider intersects a relay curve, it will show the ‘y’ coordinate of the intersecting point in seconds or cycles. In addition, it will show the time difference between adjacent intersecting points. The time difference sliders are stored in the PCC file when you save the curve collections.
TO ADD TIME DIFFERENCE SLIDERS:
1. Select the Add | Time Difference Sliders command.
Two dotted, vertical lines will appear on the screen. These are the sliders. The ‘x’ coordinate of each slider, in amps or MVA, is shown at the top and bottom of the plot where the slider intersects the x axis.
2. Move the sliders left and right as needed to show the operating time and coordinating margins between the curves.
See picture below.

Curves Window
ADD MENU