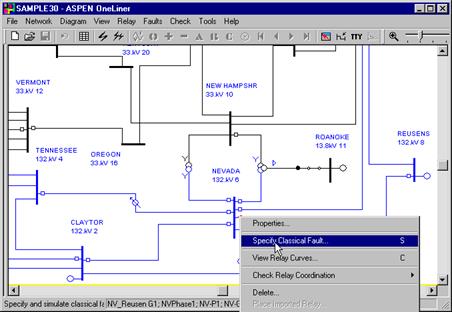
The following instructions show you how to simulate faults in the vicinity of a relay group.
1. Click the right mouse button on the third relay group on the right hand side of the bus NEVADA 132kV.
The relay group symbol will turn dotted red, and a floating menu will appear. Repeat this step if the bus or the entire line turns dotted red.

2. Click on the Specify Fault command.
A dialog box will appear asking you to specify the faults to be simulated.
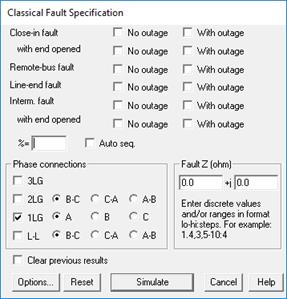
Note there are four fault types within the Phase Connection group box:
3LG: Three-phase fault. 1LG: Single phase to ground fault.
2LG: Two phase to ground fault. L-L: Line to line fault.
The “1LG” check box should already been marked.
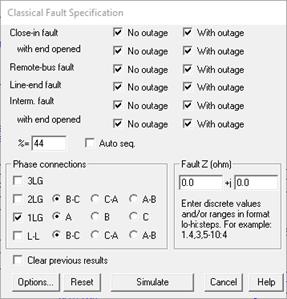
3. Click on each of the 12 check boxes labeled 'No outage' and 'With outage' to select all the available fault types.
• Close-in fault: A fault immediately in front of the selected relay group.
• Close-in fault with end opened: A fault immediately in front of the Selected relay group with the far end of the branch disconnected.
• Remote bus fault: A bus fault at the far end of the branch.
• Line-end fault: A fault at the far end of the branch with the branch disconnected from the remote bus.
• Intermediate fault (also called a sliding fault): A fault in the middle of a transmission line. This option is not available to relay groups on transformers or phase shifters.
• Intermediate fault with end opened: A fault in the middle of a transmission line with the far end of the branch disconnected.
4. Move the text cursor to the edit box labeled '%' and type in the value 44.
This specifies that the intermediate faults are at 44% of the distance between NEVADA 132 kV and REUSENS 132 kV.
We will leave the phase connection to 1LG, which stands for single line to ground, and the fault impedance to zero ohms. The fault-specification dialog box should look like this.
5. Press Simulate.
A dialog box will appear asking you to specify branch outages.
6. In the list box, mark the checkbox for the entry “6 NEVADA 132. kV – 28 ARIZONA 132. kV 1L” to outage that line.
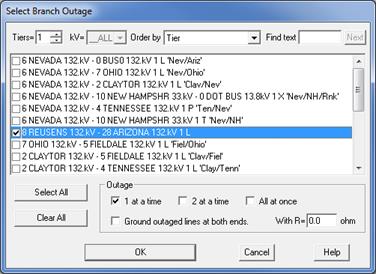
This outage will be taken for all the fault types for which the "With outage" check boxes were marked.
7. Press OK to begin fault simulation.
A dialog box will appear to inform you of the program's progress. At the end of the simulation the dialog box will disappear and the last fault simulated will be displayed on the one-line diagram. You will see a line that reads "1LG Interm. Fault on: 6 NEVADA 132.kV- 6 REUSENS 132.kV 1L 1LG Type=A… " in the status area at the bottom of the Main Window. This is a description of the fault that is being displayed.
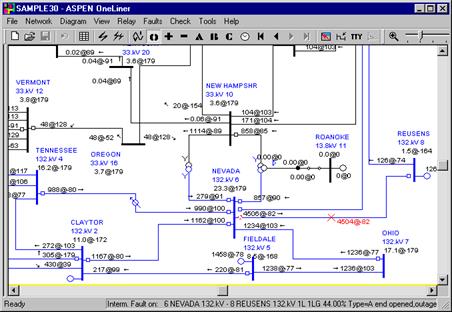
The bus voltages are shown directly beneath the bus names and nominal kV. The branch currents are shown on the branch symbols. Both the voltage and the current will be displayed as complex numbers in polar coordinates. The zero-sequence quantities are displayed by default for a single-line-to-ground fault. The '@' symbol separates the magnitude on the left from the phase angle (in degrees) on the right.
8. View other quantities on the one-line diagram.
Select the Faults | Show Fault Solution on 1-line command.
A dialog box will appear asking you to select the display options. The list box at the top of the dialog box shows the twelve faults that you just simulated. The fault being displayed is selected by default.
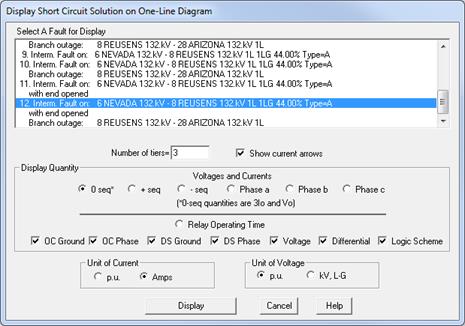
Notice the '3' in the 'No. of tiers' edit box. This tells OneLiner that you want to see the solution for all the equipment within three buses back from the fault.
9. Click “Phase a" radio button to display the phase 'a' voltages and currents.
The radio button labeled "Physical" at the lower-left corner is highlighted (by default) to indicate that the voltages will be in units of kV line-to-ground, and the currents in amperes.
10. Press Display.
The dialog box will disappear. The one-line diagram will be refreshed to show the phase 'a' currents and voltages. Note the letter 'A' between the magnitude and angle of the branch currents.
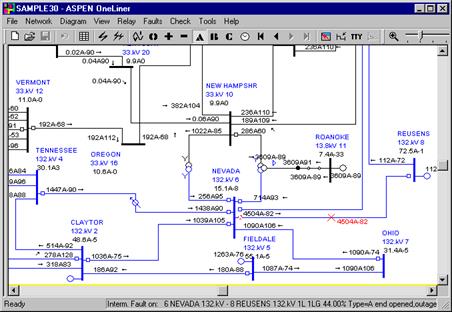
11. View other quantities using the toolbar buttons.
You can display other quantities by clicking on one of the toolbar shortcut buttons.

The '0', '+', and '-' buttons are for displaying the zero-, positive- and negative- sequence quantities, respectively. The 'A', 'B' and 'C' buttons are for displaying the phase 'A', phase 'B' and phase 'C' quantities. The button that resembles a 'clock' is used for displaying the relay operating times.
Click on the 'B' shortcut button to display the phase 'B' quantities.
The one-line diagram will be re-drawn showing the phase 'B' quantities.
12. View the fault summary in text.
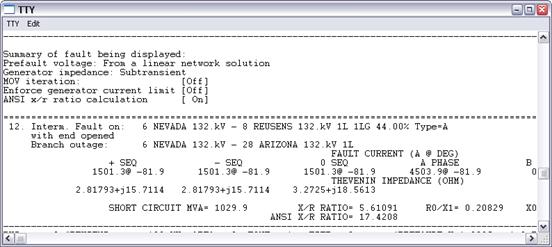
OneLiner always prepares a summary for the fault being displayed. The summary includes the fault MVA, the fault current, the relay current, the Thevenin impedance, the x/r ratio, and the voltage at both ends of the relay branch. You can see this summary by opening the TTY Window.
Click on the ‘TTY’ button on the toolbar.
The TTY Window will appear. You will see the last part of the summary when the window opens. You can click on the scroll bars of this window to bring the other parts of the summary into view.
13. Select the TTY | Close Window command to close the TTY Window.
The TTY Window will disappear.
14. Use the Phasor Probe.
Click the right mouse button on the transmission line between NEVADA 132 kV and OHIO 132 kV. The line will become highlighted and a floating menu will appear.
Click on the Show Phasors | Panel 1 command.
A pop-up window will show you the voltage and current phasors at one end of the NEVADA-OHIO line. The string “6 NEVADA 132. kV – 7 OHIO 132.kV” in the title tells you that the phasors shown are for the NEVADA end of this line.
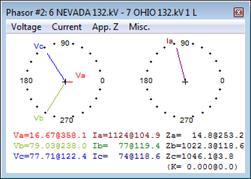
Right click on the dialog box and select Phasor properties from the pop-up menu to see all the different options that you can set for the phasor display.
Click on the red X button on the top right corner of the dialog box. The phase-probe dialog box will disappear.