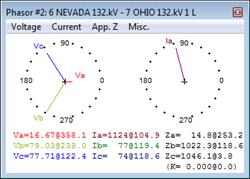
The Show Phasors commands in the Main Window allows you to view and print the voltage of buses, and the voltage and current phasors of any generator, load, shunt, line, transformer, phase shifter or switch. Before using this function, you must simulate the fault and display the voltage and currents on the one-line diagram. In addition, you must make sure that the tier limit is sufficiently high to show the voltage and currents on the network element of interest. (You can change the tier limit in the Faults | Show Fault Solution in 1-Line command.)
You can open up to three phasor panels at the same time to monitor the phasors on three different network elements. The phasor panels are modeless, meaning that you can manipulate the objects on the one-line diagram and execute Main Window commands while the phasor panels are open.
TO DISPLAY VOLTAGE AND CURRENT PHASORS:
1. Select the network element.
Click the left mouse button once on the element of interest. It will turn dotted red when selected.
2. Select the Faults | Show Phasors | Panel1, Faults | Show Phasors | Panel2, or Faults | Show Phasors | Panel3 command.
A modeless dialog box will appear displaying the voltage and current phasors.
Note: This command is dimmed if a fault is not presently being shown on the one-line diagram. See the Faults | Show Solution on 1-line command.
Shortcut: The shortcut to open a phasor panel is to hold down the <Ctrl> key and double-click on the network element that you want to monitor.

Resize this window by dragging its edges with the mouse.
Select and copy the text near the bottom of the window with the mouse.
3. You can select quantities to be displayed and other options using one of two methods:
a) Execute the menu commands under the headings “Voltage”, “Current”, “App. Z” and “Misc”.
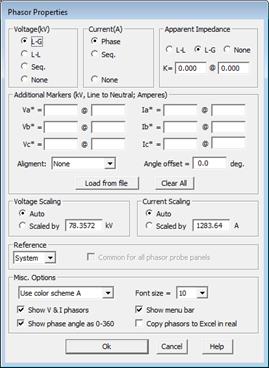
b) Bring up the Phasor Options dialog box by double-clicking anywhere on the phasor panel. The Phasor Options dialog box is shown below.

4. Select the voltage to be displayed.
L-G: Line-to-ground voltages: Va, Vb, Vc.
L-L: Line -to-line voltages: Vab (Va-Vb), Vbc (Vb-Vc), Vca (Vc-Va).
Seq.: Sequence voltages : V+, V-, Vo.
None : No voltage wil be displayed.
The voltage phasors will be redrawn accordingly. The numeric values will be in per-unit or in kV, depending on the option you specified in the Faults | Show Fault Solution on 1-Line command.
5. Select the current to be displayed.
Note: This portion is grayed out if the network element selected is a bus.
Phase: Phase currents: Ia, Ib, Ic.
Seq: Sequence currents: I+, I-, 3Io.
Neutral: Neutral current In : The current flowing to the ground from the neutral of transformer Y-connected winding. Note: This option is available only if the selected network element is a transformer.
Tert.: Tertiary current It : The circulating current in the delta winding of a 3-winding transformer. Note: This option is available only if (1) the selected network element is a Wye-Wye-Delta or an Auto Wye-Delta 3-winding transformer, and (2) you are viewing the phasors on the tertiary terminal.
None: No current will be displayed.
The current phasors will be redrawn accordingly. The numeric values will be in per-unit or in amperes, depending on the option you specified in the Faults | Show Fault Solution on 1-Line command.
6. Select the apparent impedance to fault to be displayed.
Note: This portion is grayed out if the network element selected is a bus.
L-L: Impedances that are commonly used to set phase distance relays:
Zab = (Va-Vb) / (Ia – Ib)
Zbc = (Vb-Vc) / (Ib – Ic)
Zca = (Vc-Va) / (Ic – Ia)
L-G: Impedances that are commonly used to set ground distance relays:
Za = Va / (Ia + 3K Io)
Zb = Vb / (Ib + 3K Io)
Zc = Vc / (Ic + 3K Io)
None: No Impedance will be displayed
For line-to-ground impedances, enter the zero-sequence impedance compensation factor K in the edit box of Phasor Properties dialog box. Note: K is the ratio (Zo-Z1)/(3Z1) where Z1 and Zo are the positive- and zero-sequence impedance of the line.
7. Specify addition markers to be displayed.
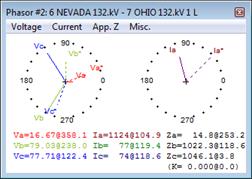
The additional markers are phasors that serve as references. A typical use of this feature is to plot the observed voltage and current phasors as markers and use them for locating a fault. There are two ways to set up the markers:
Type in the value: If you have the phasor values of the voltage or current markers already, you could type in the value directly in the format of Magnitude@Angle.
Load from an event file. Press Load from file and select an event file data in one of these formats: SEL CEV, SEL EVE or COMTRADE.
Note: You could select up to 3 channels for voltage and three channels for current. The channels for current are disabled if the selected network element is a bus.
The voltage or current loaded from an event file are waveforms. To convert them to phasors, you must enter a specified a start time in cycles using a scrollbar control.
After the phasor value are filled, you can adjust the Angle Offset to align them with any exist phasors on the probe.
Press Ok. The additional markers are drawn with dotted lines. An example is shown below.

8. Select the voltage and current scaling.
By default, the current phasors are scaled such that the longest current phasor takes up the full width of the plot, and the voltage phasors are scaled such that a 1 per-unit phasor takes up the full width. An exception to this rule is when all three phasors are very close to zero in magnitude. In that case, the phasors are not shown.
Click on the "Auto" radio button in the Voltage Scaling group box if you want the program to use the default scaling factor. Otherwise, click on the ‘Scaled by’ radio button and enter a scaling factor in kV.
Change the Current Scaling similarly in the Current Scaling group box.
Press OK. The program will redraw the phasors to reflect the scaling factors you entered.
9. Select the phasor reference.
Click on the 'Reference' drop down list box and select either ‘System’ or a voltage or current phasor to be the angle reference.
Mark the ‘Common for all phasor probe panels’ check box to apply this angle reference to all three phasor-probe panels.
The program makes no angle adjustments when you selected the ‘System’ reference. Otherwise, the program rotates counterclockwise all the voltage phasors and current phasors by an offset that is equal to the angle of the referenced phasor. This has the effect of giving the referenced phasor the appearance of having an angle of 0 degree.
The relative angle between the voltage and current phasors is not affected by this change because all the phasors were rotated by the same amount.
10. Select phasor appearance: options that can be selected are
•Color scheme.
•Font size.
•Show voltage and current vector separately
•Phase angle range: The default angle range is from -180 to 180 degree. You can change the angle range from 0 to 360 degrees.
11. Copy phasor to Excel in real time.
Mark this check box to have voltage and current phasor values of active phasor panel(s) copied automatically to spreadsheet(s) in an Excel workbook. OneLiner will update voltage and current phasor values in Excel worksheet cells to keep them in synch with fault solution being displayed in the phasor panels.
You can implement any custom logics to record and to analyze the simulation results in the Excel workbook.
Note: This check box is only available if Microsoft Excel application is available on the PC on which OneLiner is running.
12. Show menu bar.
Mark this check box to display menu bar with commands to select phasor quantities and create output.
13. Output the phasor quantities.
The following commands can be invoked by right-mouse click on the Phasor Panel, and then choose the command from the floating menu:
Print Phasor Graphics to Default Printer: Print voltage and current phasors to the current printer. You can change the current printer with the File | Print Setup command.
Print Text Result To TTY Window: Output the numeric value of the voltage and current phasors and apparent fault impedance to the TTY Window.
The TTY Window will open to show you something like this:

Copy Text Result To Windows Clipboard: Copy numeric value of the voltage and current phasors and apparent fault impedance to Windows clipboard. Clipboard phasor data fields placement is identical to that in TTY window report above, except that all complex number quantities are printed in rectangular form (real and imaginary parts). Clipboard data are formatted to be pasted correctly as separate cells in spreadsheet.
14. Close the Phasor Panel.
You can close the phasor panel manually by clicking on the close-window button at the upper right corner of the window.
Main Window
FAULTS MENU