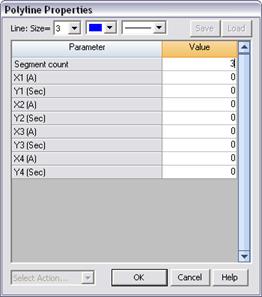
The Add | Shape command in the OC Curves Window lets you add a graphical shape in the plot. Currently the only shape available in the OC Curves Window is “polyline”, a series of segments connecting adjacent points. The shapes are stored in the PCC file when you save the curve collections.
To execute this command you must first select the shape location with the left mouse button.
TO ADD A NEW SHAPE:
1. Select the shape location.
Click the left mouse button once on the desired location of the new shape.
A red crosshair will appear at that location.
2. Select the Add | Shape command.
The Shape dialog box will appear.

3. Enter the total number of points in the first entry of the data grid, labeled “Segment count”.
4. Enter into the data grid the x and y coordinates of the points.
X is in Amperes. Y is in seconds.
5. At the top of the dialog box, specify the line thickness, line color, and line style.
6. Press OK.
The polyline shape will appear on the plot.
Curves Window
ADD MENU