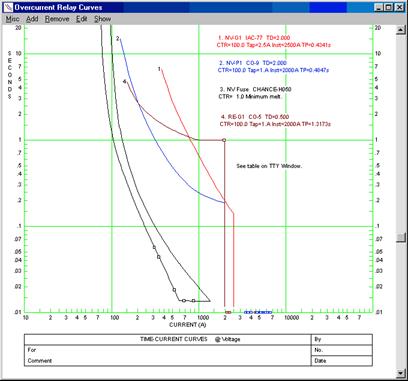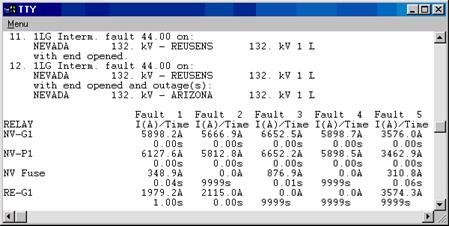
This command shows graphically the relay operating points (current, time) for all the faults that have been simulated. A tabular output is also written to the TTY Window.
TO SHOW THE RELAY OPERATIONS FOR ALL FAULTS:
1. Select the Show | Relay Operations for All Faults command.
Note: The menu item is dimmed and cannot be activated if no faults have been simulated or if you have modified the network since the last fault simulation.
The screen will be redrawn to show on each relay curve the operating points (current, time) for all the faults that have been simulated. These points are indicated by small rectangles. Curves and operating points will be shifted if you have specified horizontal and vertical shifting factors with the Edit | Shifting Factor command.

This command will also automatically produce a table of relay currents and operating times in the TTY Window.
2. Select the Show | TTY Window command to open the TTY Window.

Any fault solutions being displayed in the Main Window prior to this command will be cleared.
Curves Window
SHOW MENU