This command lets you show graphically the operating points (current, time) on the relay curves for a fault that was simulated previously. The curves and operating times on the plot can be shifted manually or automatically. The program will simultaneously display the solution on the one-line diagram in the Main Window.
TO SHOW THE RELAY OPERATIONS FOR A FAULT:
1. Select the Show | Relay Operations for 1 Fault command.
Note: The menu item is dimmed and cannot be activated if no faults have been simulated or if you have modified the network since the last fault simulation.
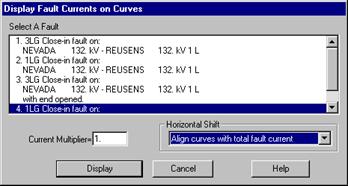
A dialog box will appear asking you to select a fault. The list box will contain all the faults that have been simulated.

2. Select a fault.
If the fault description takes more than one line, you can select it by clicking on any one of those lines.
3. Enter a 'Current Multiplier' to scale the relay current by a constant.
The current multiplier is set to 1.0 by default. You can change this value to scale all the relay currents. This option is most commonly used to check relay coordination with relay currents that are larger or smaller than the actual fault currents.
4. Select a Horizontal Shift option.
Click on the drop down list and select one of the options:
- 'Manual': to horizontally shift each of the relay curves by the shifting factor 'H', which is 1 by default. This option is so called because you can shift each curve manually by changing its shifting factor ’H’ in the Edit | Shifting Factor command. The curves are not shifted if you did not specify the manual shifting factors.
- 'Align curves with total fault current': to shift each relay curve horizontally by the factor: (total fault current) / (relay current). This is the same as the old “Automatic” option in previous versions.
- 'Align curves with custom current': to shift each relay curve horizontally by the factor: (custom current) / (relay current). The program will display a dialog box asking you to enter the custom current.
- 'Align curves with relay #xx ': to shift each relay curve horizontally by the factor: (relay #xx current) / (relay current). The result is that relay curve #xx stays where it is, while all the other relays curves are shifted so that their operating points are aligned with that of the relay curve #xx. Note: if the reference relay #xx does not operate on the fault, the shifting factors will be based on the total fault current.
When the curves are shifted automatically, the program will ignore the manual horizontal shifting factor ‘H’.
Note: The program will use the vertical shifting factors 'B' and 'C' in all cases, regardless of the Horizontal Shift Option you select.
5. Press OK.
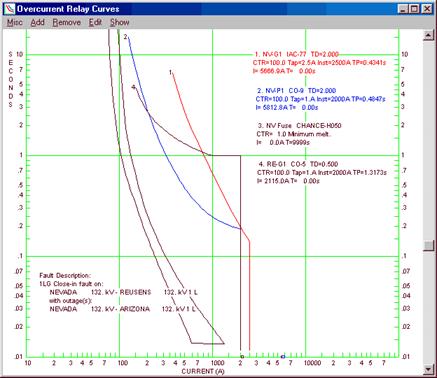
The dialog box will disappear. The OC Curves Window will be redrawn to show the operating point (current, time) for each of the curves. The fault description is shown. In addition, the relay current and operating time are added below the relay identifiers. See example below.

A summary of the fault is written to the TTY Window. The relay test quantities (consisting of the currents and voltages before and after the fault) are also written to the TTY Window if the “Write to TTY” option within the “Relay Test Quantities” group box is selected.
6. Optional: Select the Show | TTY Window command to open the TTY Window.
The Main Window will be also redrawn to show the same fault on the one-line diagram. The shifting factors and options have no effect on the relay operating time on the one-line diagram.
Curves Window
SHOW MENU