This command will automatically simulate bus faults and intermediate faults in the vicinity of a monitored bus (i.e., the location of a voltage sensitive customer) and tabulate the voltage at the monitored bus. Faults that cause the monitored voltage to dip below the threshold are flagged.
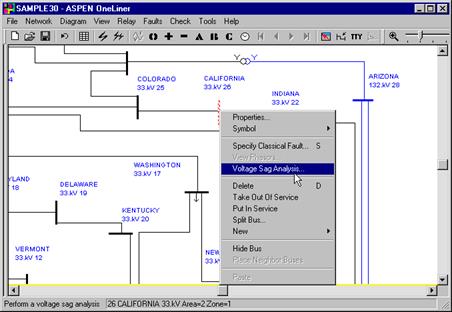
1. Click right mouse button on ‘California 33.kV’ bus.
The bus symbol will be highlighted in dotted red and a pop-up menu will appear.

2. Select the Fault | Voltage Sag Analysis command.
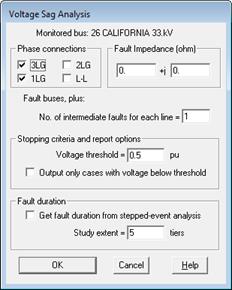
A dialog box will appear asking you to specify the input parameters.
Mark the ‘1LG’ and ‘L-L’ checkboxes to simulate single-line-to-ground and line-to-line faults.

3. Set 'Voltage threshold' to 0.6 per-unit.
The voltage threshold is used as a stopping criterion for the fault simulations. The faults are applied first at the monitored bus, then at lines and buses one bus away, and two buses away, and so on, until the monitored-bus voltage for faults at a certain number of buses away is above the threshold of 0.6 per unit.
4. Leave the 'No. of intermediate faults for each line' at its default setting 1.
The program will place an intermediate fault at the midpoint of all transmission lines.
5. Press OK.
The program will ask you for an output file name.
Use controls in the standard file-save dialog box to specify an output file name of “a.csv”

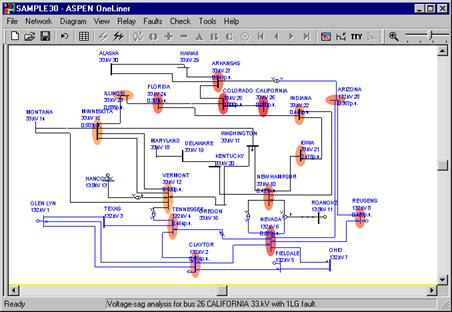
When the analysis is complete, OneLiner will display the voltage-sag results on the one-line diagram. Specifically, the monitored-bus voltage in per unit will be shown below each faulted bus name. The program will also paint a colored halo around each faulted bus to help you visualize its effect on the monitored bus. The more severe the voltage sag at the monitored bus caused by a fault, the darker halo will be painted around the faulted bus.
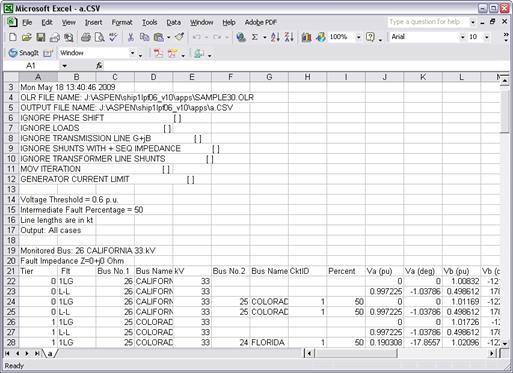
6. View the CSV file.
The program will ask you whether you want to view the .CSV file with your spreadsheet program. Answer ‘Yes’.
You will see a window that looks like this.
