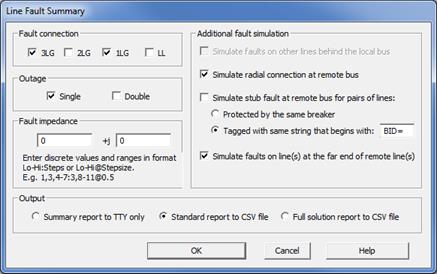
The Line Fault Summary Command in the Main Window lets you create a report of relay currents, voltages and apparent impedance at a line terminal for faults on the line’s near- and far-end buses as well as on other transmission lines in the vicinity. The faults simulated can include contingency of single and double outage of lines and transformers as well as breaker-failure conditions. The report, which includes a summary table with maximum and minimum currents, is saved in a CSV-formatted file that can be opened in a spreadsheet program for further processing. Prior to executing this command, you must select a relay group on a transmission line.
TO GENERATE A LINE FAULT SUMMARY:
1. Select a relay group that is on one end of a transmission line.
Right mouse click on a relay-group symbol that is on a line. The relay group will turn red.
2. Select the Fault | Line Fault Summary command.
A dialog box will appear asking you to specify the options.

3. Select fault connection: One or more of the following: 3LG, 2LG, 1LG and LL
4. Select outage condition: Single and/or double outages.
Outages are applied to all lines, transformers, switches and phase shifters at the two ends of the selected line.
5. Additional fault simulation:
Simulate faults on other lines behind the local bus: Line-end faults are simulated on all lines behind the local bus. In the solution report, these faults are marked as BACKEND. This information is used to set the backward-looking zones of the relay.
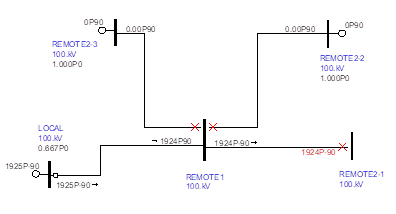
Simulate radial connection: Simulate line-end fault on remote line(s) after a breaker failure condition had resulted in the removal of all additional infeeds at this bus. . The picture below shows an example of a radial connection simulation. In the solution report, these simulations are listed under type RADIAL.
Simulate stub fault: Simulate line-end fault on remote line(s) after a breaker shared by local and remote lines had failed to open and resulted in the bus being split in two segments. The picture below shows an example of a stub fault simulation. (The circuit breaker shared by the 2 bottom lines is stuck.) . In the solution report, these simulations are listed under type STUB.
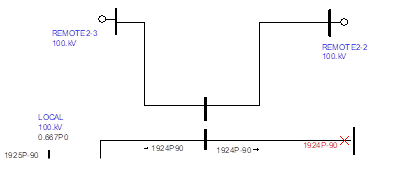
Select method to determine the pair of local and remote lines in stub fault simulation:
‘Protected by the same breaker’: Stub fault will be simulated for a line pairs when both lines are included in protected equipment list of the same breaker.
‘Tagged with same tag that begins with’: Stub fault will be simulated for a pair if the two lines are tagged with same tag string with special prefix that you define in this dialog box.
Simulate faults on lines on far end of remote lines: Line-end fault and remote bus fault are simulated on all lines on far end of the remote lines. In the solution report, these faults are marked as FARBUS3.
6. Enter the fault impedance in 'Fault Z (ohm)'. You can enter multiple discrete values and also range of values separated by comma. Range can be entered in one of the two formats: Low-Hi@StepSize or Lo-Hi:NumberOfSteps
7. Select output format.
Summary to TTY only: Summary report shows the minimum and maximum magnitude of phase, residual (3Io) and negative sequence current plus phase-to-phase and phase-to-ground apparent impedance as seen at the selected terminal across all faults and contingency conditions that had been simulated, which include:
CLOSEIN faults at selected
terminal
FARBUS1 faults at far end of the line
EOL1
line-end faults
RADIAL
radial conditions to remote line
STUB
stub faults at remote bus
FARBUS2
faults at far end of remote line
EOL2
line-end on remote line
FARBUS3
fault at far end of next level remote line
EOL3
line-end fault on next level remote
line
BACKEND line-end fault on line behind the local bus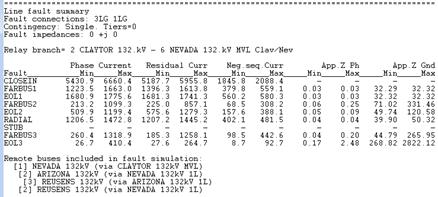
Standard report to CSV file: CSV file report includes the phase, residual, negative sequence current and fault apparent impedance seen at line terminal in each of the fault simulations. The report also includes summary table with minimum and maximum of these currents and impedances in all simulations.
Full report to CSV file: Full report includes the summary table above as well as listing of magnitude and angle of relay currents, voltages and fault apparent impedance in each of the faults in the simulation.
An information dialog box will appear when the output file is complete.

Click on Yes to view the fault simulation report.
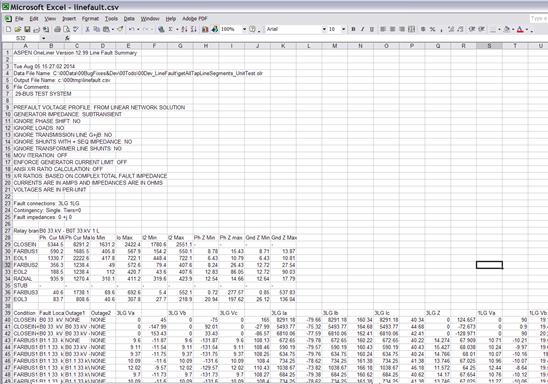
Line fault report data fields:
Condition: Fault condition simulated, which can be one of: CLOSEIN, FARBUS1, FARBUS2, FARBUS3, EOL1, EOL2, EOL3, RADIAL, STUB plus OUTAGE1 (single contingency) OUTAGE2 (double contingency) at locations: LOCAL, BUS1, BUS2 or BUS3.
Fault location: Location of fault.
Outage 1: Branch involved in single or double contingency.
Outage 2: Branch involved in double contingency.
3LG Va. Vb, Vc Magnitude and angle of relay phase voltage in 3LG fault.
3LG Ia, Ib, Ic Magnitude and angle of relay phase current in 3LG fault.
3LG Z: Magnitude and angle of apparent impedance seen at relay location in 3LG fault.
2LG Va. Vb, Vc Magnitude and angle of relay phase voltage in 2LG fault.
2LG Ia, Ib, Ic Magnitude and angle of relay phase current in 2LG fault.
2LG Z: Magnitude and angle of apparent impedance seen at relay location in 2LG fault.
1LG Va. Vb, Vc Magnitude and angle of relay phase voltage in 1LG fault.
1LG Ia, Ib, Ic Magnitude and angle of relay phase current in 1LG fault.
1LG Z: Magnitude and angle of apparent impedance seen at relay location in 1LG fault.
LL Va. Vb, Vc Magnitude and angle of relay phase voltage in LL fault.
LL Ia, Ib, Ic Magnitude and angle of relay phase current in LL fault.
LL Z: Magnitude and angle of apparent impedance seen at relay location in 3LG fault.
Fault Desc. Full OneLiner fault simulation description string.
Main Window
FAULTS MENU