OneLiner lets you plot overcurrent relay curves on the OC Curves Window.
1. The relay group on the line between NEVADA 132 kV and REUSENS 132 kV should still be highlighted. Click on it with the right mouse button.
A floating menu will appear.
2. Click on the View Relay Curves command in the floating menu.
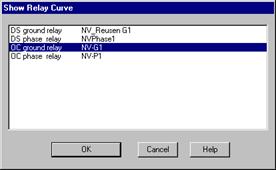
A dialog box will appear asking you which of the relays in the relay group you want to display.

3. Click on the entry 'OC ground relay NV-G1' in the list box.
Click on the "OK" button.
The OC Curves Window will appear showing the characteristics of the overcurrent relay NV-G1. The relay parameters will be shown inside a box to the right of the plot.
4. We will add the curves of several neighboring relays to this plot.
Select the Add | Relay Curves command.
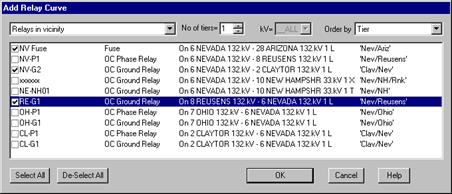
A dialog box will appear asking you to select the relay curves to be added to the plot. The list box labeled "Relays in Vicinity" contains the relays that are in the vicinity of the relay being displayed.
5. Increase the ‘No of tiers’ to 1. Select the entries for NV Fuse, NV-G2 and RE-G1 in the list box by marking the check box in front of each name.
6. Click on the “OK” button.
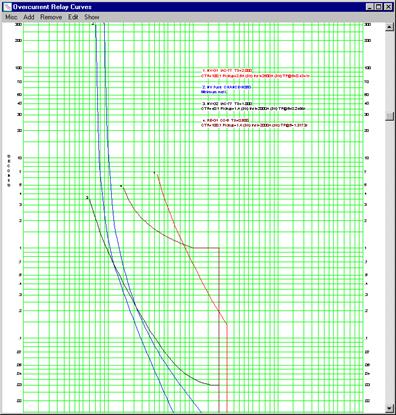
The dialog box will disappear. The characteristics of the three relays you selected will be displayed on the same plot as the first relay. The parameters of the added relays will also be shown in boxes to the right of the plot. Note the relay curves and the parameter boxes are numbered from 1 through 4.
We are now ready to display the relay operations on the plot.
7. Select the Show | Relay Operations for 1 Fault command.
A dialog box will appear asking you to select one of the fault solutions.
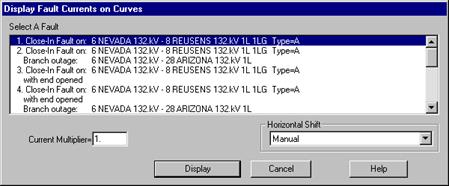
The fault being displayed on the one-line diagram is selected by default.
8. Scroll the list to the first fault, '1LG Close-in fault on: 6 Nevada 132 kV-8 Reusens 132 kV 1L 1LG Type=A', and select it. Select ‘Manual’ in the Horizontal Shift option. Click on the "Display" button.
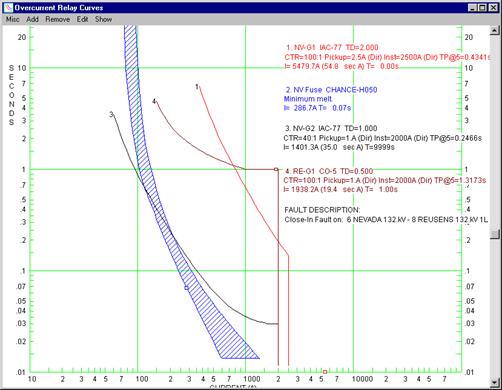
The dialog box will disappear. The OC Curves Window will be refreshed to show the time-current points on each of the curves. The relay current and operating time will be added to the respective parameter boxes and the fault description will be shown below the relay-parameter boxes.
You can specify different options that will dictate how the curves are displayed using the Misc. | Options command.
9. Select the Misc. | Options command.
A dialog box will appear allowing you to set certain parameters within the OC Curves Window.
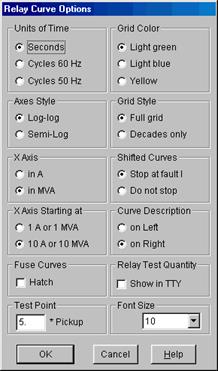
Click on 'Hatch' within the Fuse Curves box to fill in the area between the total clear and minimum melt curves.
Click on 'Decades only' within the Grid Style box to display only the decade lines on the OC Curves Window.
Press OK to close the Misc. | Options dialog box.
The OC Curves Window should appear as shown below.
