The Bus Fault command in the Main Window generates a table with fault current and X/R ratio for a number of buses. The result is written to a CSV-formatted file that can be opened with any spreadsheet program.
This command can also be used to locate buses whose fault currents deviates more than a certain percentage over a baseline case. This feature, new in version 14, is designed to meet one of the requirements of the PRC-027 Standard.
TO CREATE A BUS FAULT SUMMARY:
1. Select the Faults | Bus Fault Summary command.
A dialog box will appear asking you for bus fault summary parameters.

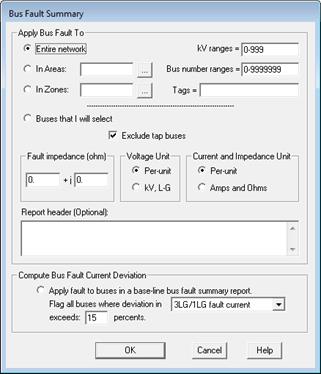
2a. To run a bus fault summary study:
Click on Entire network to fault every bus in the network.
Click on In Areas or In Zones and enter area/zone numbers to fault every bus in these areas/zones.
Enter additional bus selection filters: kV ranges, Bus number ranges and tags
Click on Buses that I will select to fault selected buses only. The program will ask you to select the buses later.
Mark the check box ‘Exclude tap buses’ if you want to omit faulting tap buses.
Enter fault impedance in the edit boxes. This impedance will be used for all the faults.
In the “Unit of current and impedance” group box, press the "p.u." radio button to display currents and impedances in per unit, or the “Amps and ohms” radio button to display currents and impedances in physical units.
In the “Unit of Voltage” group box, press the "p.u." radio button to display bus voltages in per unit, or the “kV, L-G” radio button to display voltages in kV, line-to-ground.
Enter header text for the fault summary report. This text will be shown at the beginning of the report file.
2b. To compute bus fault current deviation from a base-line study:
Click on Apply faults to buses in a base-line bus fault summary report to fault the same buses that were in a report generated by a previous execution of this command. The program will ask you to enter the name of the existing bus fault summary report later.
Select current for deviation calculation: The 3LG/1LG fault current or the 3LG/1LG/2LG/LL Max. phase/ground fault current.
Enter threshold percent value to include in the bus fault summary report a fault current comparison summary table.
Note: The program will automatically use bus selection criteria and other bus fault summary parameters in the base-line bus fault summary report so that the current comparison result is accurate.
3. Press OK to create the bus fault summary.
If you elected to fault selected bus, the Bus selector dialog will appear.
Use the bus selector controls to build a list of buses that you want to include in the fault summary. See APPENDIX H: BUS SELECTOR for more information on the Bus Selector. Press OK when done.
If you elected to use compute bus fault current deviation from an existing base-line bus fault summary report, a File Open dialog box will appear.
Use the standard controls in the dialog to specify name and location of the existing CSV-formatted bus fault summary output file.
A File Save dialog will appear.
Use the standard controls in the dialog to specify name and location of the new CSV-formatted output file.
Press Save when done. The program will create the output file at the location specified. As information dialog box will appear when the output file is complete.

Press Yes to view the fault summary.

Bus fault summary file data fields are:
NO: Bus number
BUS: Bus name
KV: Bus nominal kV
LOCATION, Area, Zone: Bus location, and area and zone number.
Prefault V PU: Pre-fault bus voltage in per-unit
3LG Phase cur, Gnd cur, MVA, X/R: 3-phase fault currents in amps, fault MVA and X/R ratio.
2LG Phase cur, Gnd cur, MVA, X/R: 2-line-to-ground fault currents in amps, fault MVA and X/R ratio.
1LG Phase cur, Gnd cur, MVA, X/R: single-line-to-ground fault currents in amps, fault MVA and X/R ratio.
L-L Phase curr, Gnd cur, MVA, X/R: line-to-line fault currents in amps, fault MVA and X/R ratio.
Max Phase cur: Maximum phase current among all the faults on this bus.
Max Gnd cur: Maximum ground current among all the faults on this bus.
Z+, Z-, Z0: Positive-, negative- and zero-sequence Thevenin impedances in ohms.
SCFLAG_3LG, SCFLAG_2LG, SCFLAG_1LG, SCFLAG_LL: Lists of MOV-protection of series capacitors that operated in each of four faults on this bus.
Note: The X/R ratios in the report are ANSI/IEEE X/R ratios or complex X/R ratios, depending on the option you selected in the Fault | X/R Ratios command.
The columns for series capacitors are not shown if MOV iteration is not turned on in the Fault Simulation tab of the File | Preferences dialog box.
Base-line 3LG and 1LG fault currents or maximum phase and ground fault current among all the faults on this bus in the base-line case.
Note: These two columns are included in the bus fault summary report when and only when the Compute Base Fault Current Deviation option was selected.
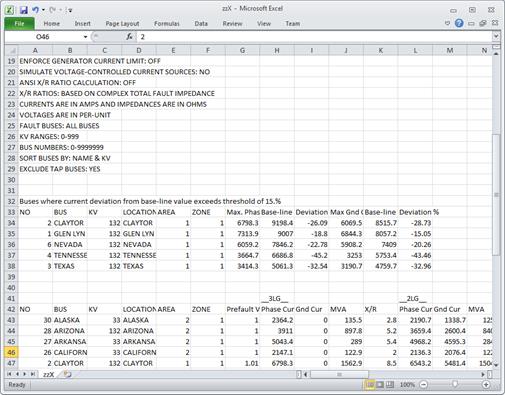
Bus fault current deviation report data fields are:
NO: Bus number
BUS: Bus name
KV: Bus nominal kV
LOCATION, Area, Zone: Bus location, and area and zone number.
3LG or Max Phase cur, Base-line Max Phase cur, % deviation 3LG fault current or maximum phase current among all the faults on this bus in this case, in the base-line case and percent deviation between the two.
1LG or Base-line Max Phase cur, % deviation 1LG fault currents or maximum ground current among all the faults on this bus in this case, in the base-line case and percent deviation between the two.
Main Window
FAULTS MENU