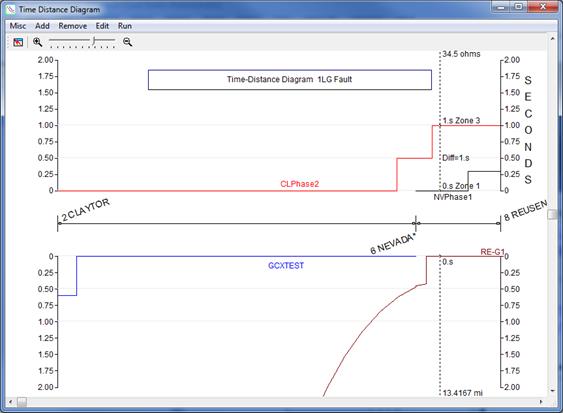
The Time-Distance Diagram Window displays the time-versus-distance operating characteristics of overcurrent relays, fuses, reclosers and distance relays. You can open this window with Main Window’s Relay | View Time-Distance Diagram command. If you have saved time-distance diagrams in PTD files, you can open this window with Main Window’s Relay | Open Previous Time-Distance Diagram command.
On the horizontal axis are a number of nodes that are connected through a path consisting of lines and closed switches. In some cases the same node can appear more than once because the path can loop back on itself. Buses are shown as vertical lines. (Symbols for tap buses are shorter than those of regular buses.) The distance between adjacent buses is scaled based on the impedance of the branch that connects them. Near the ends of each branch are little squares that represent relay groups.
You can display up to 7 curves at each of the relay groups.
The horizontal axis divides the time-distance diagram into two halves – top and bottom, each with its own vertical time axis. The time axis for the top half increases going up. The time axis for the bottom half increases going downward. Both time axes are linear and not logarithmic. The unit of time can be cycle or second.
The top portion of the time-distance diagram is for showing the time characteristics of relays that “look” from left to right, and the bottom portion is for showing the time characteristics of relays that look from right to left.
You can adjust the total width of the time-distance diagram by dragging any of the bus symbols -- except the leftmost one --left or right. The length of the vertical time axes can be 2 or 4 seconds.
A sample time-distance diagram is shown below.

In this picture, a vertical dotted line, called the “slider”, is used to show the operating time and zone number of the relays, as well as the coordinating margin between different curves. At the bottom of the slider is the distance from the first bus CLAYTOR. You can have up to two sliders. You can move them with the mouse.
The cursor coordinates (X,Y) are shown next to mouse cursor when you press either mouse button down on an empty spot and then drag the mouse. X is the distance from the leftmost bus in ohms, and Y is the time in either seconds or cycles.
Clicking the right mouse button on the Time-Distance Window will bring up a floating menu of commonly-used commands. The commands vary depending on what you clicked on.
Double-clicking the mouse on a relay-group symbol will bring up a dialog box that lets you choose which curve or curves to be displayed.
Clicking the right mouse button on a curve name will cause OneLiner to draw the corresponding curve with a black dash pen. This feature is intended to help you keep track of which curve is which.
Double-clicking the right mouse button on a curve name will bring up the info dialog box for the corresponding protective device.
Nearly everything on this diagram is moveable with the mouse. You can move the name of the bus in 45-degree increment in clockwise or counter-clockwise direction. You can also move the name of the relays, the caption block and the annotations.
You can work on the Time-Distance Window and the Main Window at the same time. If you have a large monitor, you can arrange the windows side by side and execute commands in both windows. Any network modifications you make on the one-line diagram will be reflected in the time-distance diagram. For instance, if you toggle open a switch on the one-line diagram and that switch happened to be on the time-distance diagram, the switch and the portion of the diagram to the right of the switch will disappear.
You can store the bus, branch and relay selection, annotations and other object being displayed in the Time-Distance Window to a ‘previous time-distance diagram’ file with .PTD extension. When you recall the time-distance collection later with Main Window’s Relay | View Previous Time-Distance Diagram, or this window’s Misc | View Previous Time-Distance Diagram command, and execute the Run command, the time-distance diagrams for the same relays will reappear.
The commands in the Time-Distance Window are described in this section.
Time-Distance Window