ASPEN OneLiner is a PC- and Windows-based short circuit and relay coordination program for relay engineers. OneLiner is a productivity tool. It relieves the engineer from the tedious and time-consuming tasks of leafing through stacks of printouts and plotting and re-plotting relay curves and one-line diagrams. OneLiner works very quickly under the control of the engineer. The engineer can change the relay settings and network configuration and see the results of the change immediately. The following are some highlights of OneLiner:
• Native Microsoft Windows program with easy-to-use interactive graphics interface under Windows 8 and 10 with built-in PC network support.
• Accurate modeling of 2- and 3-winding transformers, phase shifters, lines, switches, series capacitors (with and without nonlinear MOV elements), series reactors, dc lines (capacitor-compensated dc lines and terminals, as well as VSC converter terminals), synchronous generators, type-3 wind plant, converter-interfaced resources, loads, shunts and zero-sequence mutual coupling.
• Detailed modeling of fuses, reclosers and overcurrent relays. Comes with an extensive relay library that can be edited by the user.
• Detailed modeling of distance relays using make and model-specific parameters and operating logic.
• Modeling of differential relays, voltage relays and protection logic schemes and reclosing of lines.
• Built-in short circuit program that simulates the following fault types: bus faults, and line-end, line-out, intermediate faults, bus-to-bus fault and phase-open faults.
• Unlimited system size with modest memory requirement.
• Lightning fast solution speed.
• Advanced analysis tools: stepped-event simulation, boundary equivalence, voltage sag calculation, fault location, arc-flash analysis, breaker rating checking, and more.
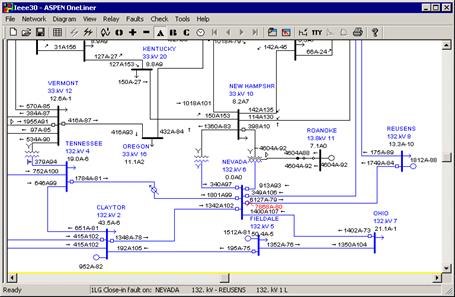
• Graphical display of post-fault solution and relay operating time on the one-line diagram and on phasor diagrams (figures 1.1, 1.2 and 1.3).
• Automatic system-wide checking of relay parameters and relay coordination.
• Automatic plotting of overcurrent and distance relay characteristics on the screen (figures 1.5 and 1.6).
• Automatic plotting of time-distance diagram (figure 1.4).
• Tools for PRC-023, -025, -026 and -027 compliance.
• Built-in network comparison and merge engine for network model data management.
• Built-in application programming interface engine that supports BASIC, Python and other programming languages.
• CIM standard support.
• Data importing for network data in ANAFAS, ANAREDE, GE, PTI PSS/E, T2000 and other formats.
• Data exporting in PTI PSS/E, ANAFAS, ANAREDE and GE data formats.
• Exporting of fault data for relay testing in COMTRADE, Doble and other formats.
• Two-way data exchange with ASPEN Relay Database.
• Proven reliability at hundreds of electric utilities and consulting companies in the U.S. and abroad.
Figure 1.1: OneLiner shows the post-fault voltages and currents on the one-line diagram for the fault described in the status bar at the bottom of the window. The branch currents shown in this case are Ia in amps. The phase angles in degrees are shown after the 'A' symbol. The phase-A bus voltages in kV, line-to-ground, are shown under the bus names.
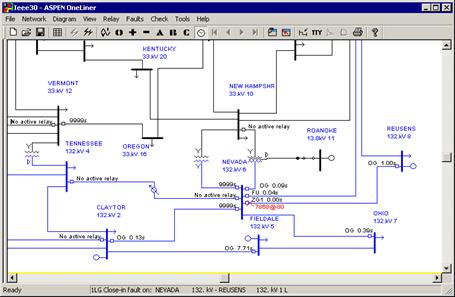
Figure 1.2: OneLiner displays the relay operating time for the fault indicated on the status line. The relay operating time is shown next to each relay group. The time in seconds is preceded by OP if it is from an overcurrent phase relay, OG if from an overcurrent ground relay, FU if from a fuse, ZPn if from a distance phase relay (n is the zone number), and ZGn if from a distance ground relay.
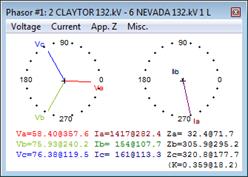
Figure 1.3: A “phasor probe” feature allows you to see readily the voltage and current phasors at any point in the one-line diagram. This picture clearly shows that in this single-line-to-line fault, the current in phase 'a' leads the quadrature voltage Vb-Vc by about 13 degrees.
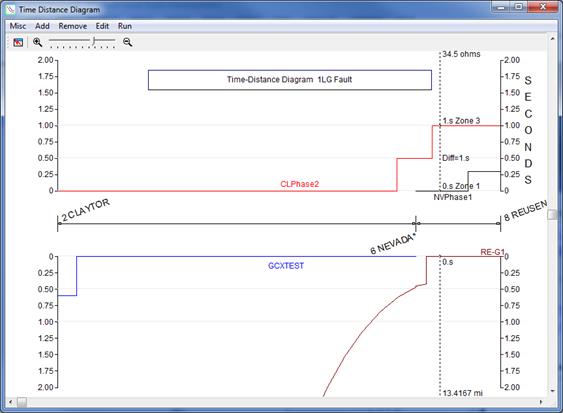
Figure 1.4: The TTY Window shows the Time-Distance Window. The vertical axis is time. The horizontal axis is the impedance of the lines, in this case, the line between buses Claytor and Nevada, and the line between Nevada and Reusens. The top half of the diagram is for the time-distance curves of overcurrent and distance relays that “look” from left to right, the bottom half is for curves of relays that look for right to left.
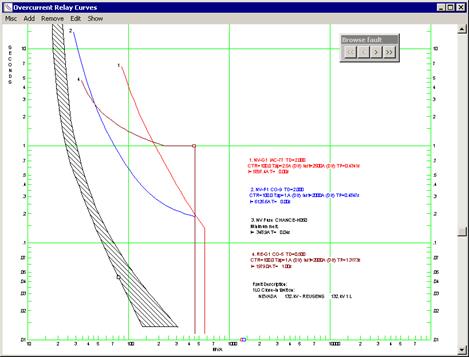
Figure 1.5: OneLiner displays overcurrent characteristics for a fault. The relay current and operating time is shown in text and as points on the relay curves. You have the option of having the curves shifted automatically or manually. You can also store a series of curve collections in a binary file for later recalling.

Figure 1.6: OneLiner displays the characteristics of two distance relays on the same graph in primary ohms. The impedance of the transmission line is shown as a slanted line from the origin. The fault impedance Va/Ia is plotted as a point on the complex plane.
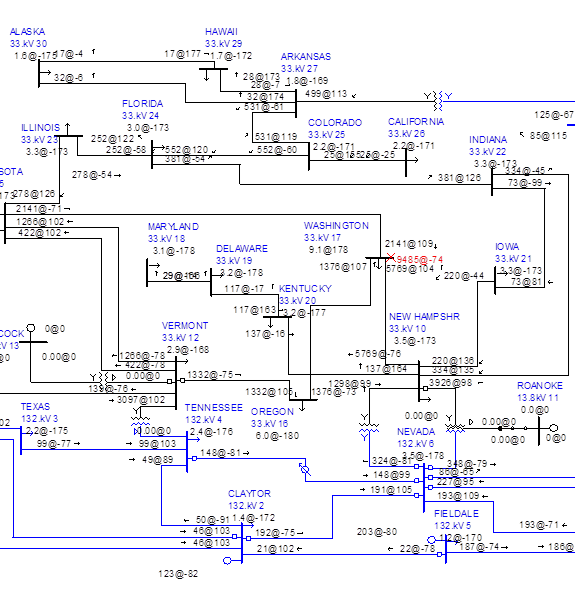
Figure 1.7: An unretouched printed output from OneLiner showing the zero-sequence post-fault currents (3Io) and voltages for a single-line-to-ground fault at bus WASHINGTON 33kV (near the center).

Figure 1.8: An unretouched printed output from OneLiner showing overcurrent relay curves and damage curves. The relay current and operating time is shown both as points on the curves and as text within the description boxes. The fault description on the left indicates that the voltages and currents were taken from an intermediate fault on a transmission line.